Data VisualizationTool DesignBachelor's Thesis2019
SpaceGraph — making spatial relationships visible.
Designing a building with many spaces means managing relationships between all of them at once. I tried the standard tools, found them lacking, and ended up building something of my own.
3Tools explored
SoloProject
BScThesis
Where it started
A building with a lot of spaces and no clear way to see how they fit together.
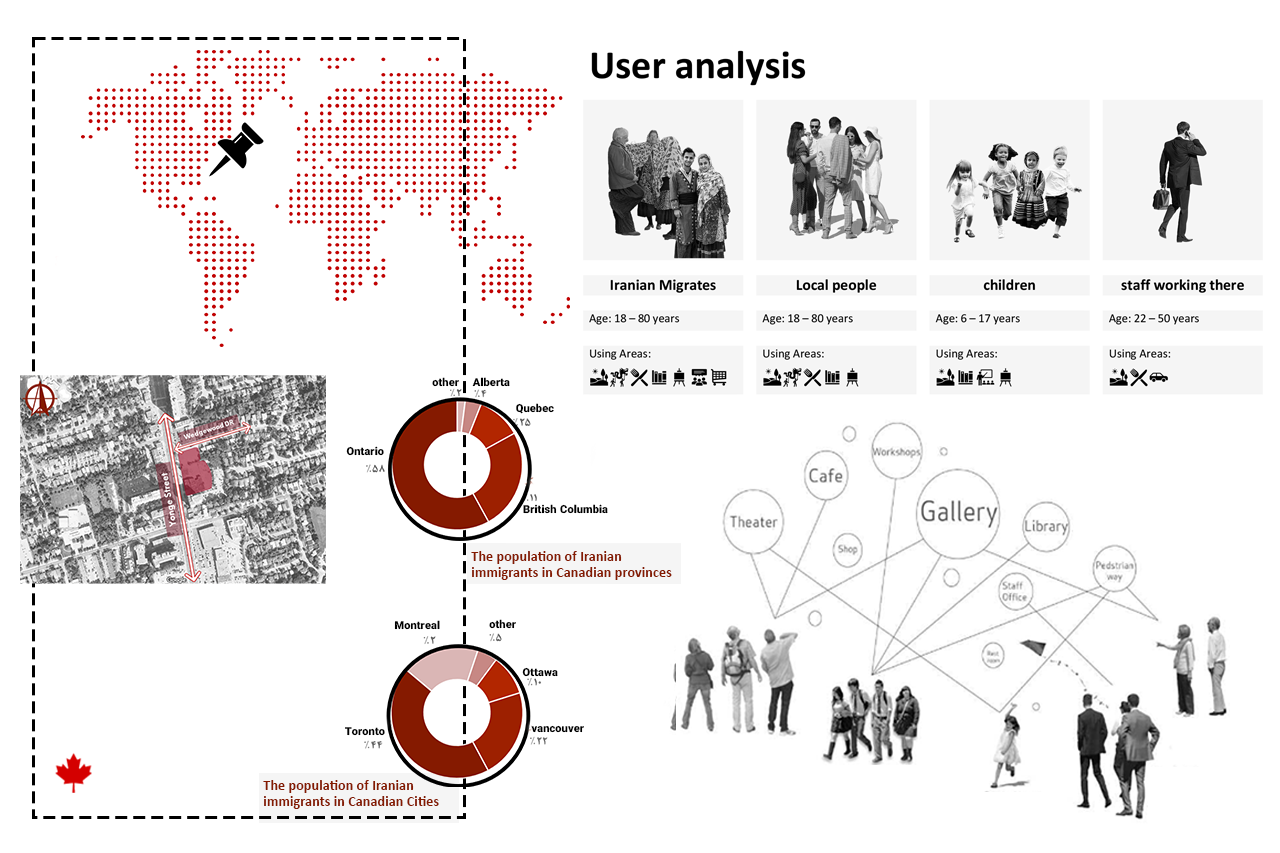
For my bachelor's thesis, I was designing a cultural and community center in Toronto for Iranian immigrants. Before touching the spatial design, I researched the population data, user groups, and what kinds of spaces the building actually needed: a theater, gallery, library, cafe, workshops, commercial areas, and more across two floors.
Each space had a required size and a set of functional relationships with every other space. Some needed to be close, some needed separation, some needed vertical connections across floors. Managing all of that at once was where things got complicated.
User research and demographic analysis: population distribution of Iranian immigrants across Canadian provinces and cities, and the four main user groups for the building.
The Problem
The standard tool gave me data. It didn't help me think.
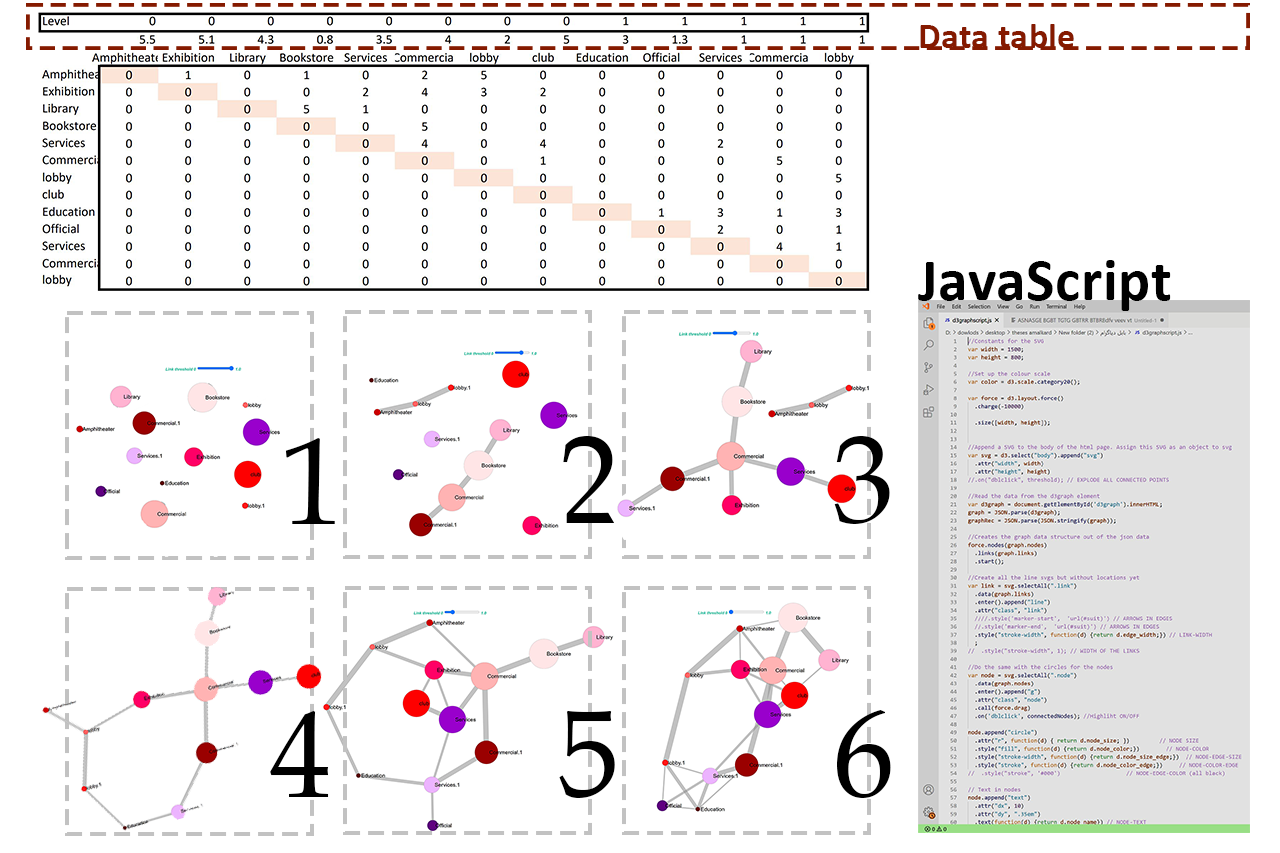
Architects typically use a concordance matrix for this kind of problem: a grid where you mark the desired relationship between every pair of spaces. I filled one in for all 13 spaces across two floors. The data was there, but staring at a table of numbers didn't help me understand anything spatially. I could read it, but I couldn't see the building.
The matrix told me what. It didn't help me see why.
When you're trying to understand which clusters of rooms belong together and how strongly they pull toward each other, a table is the wrong format. I needed something I could look at and immediately understand, not decode.
The Process
Two dead ends and one tool that worked.
Getting to SpaceGraph took two earlier attempts. Each one solved part of the problem and revealed a new limitation.
First try
Concordance Matrix
The standard architectural tool: a grid marking relationship strength between every pair of spaces. I entered all the data for all 13 spaces across both floors.
The problem: it's still just a table. Hard to read spatially, impossible to see clusters or compare configurations visually.
Second try
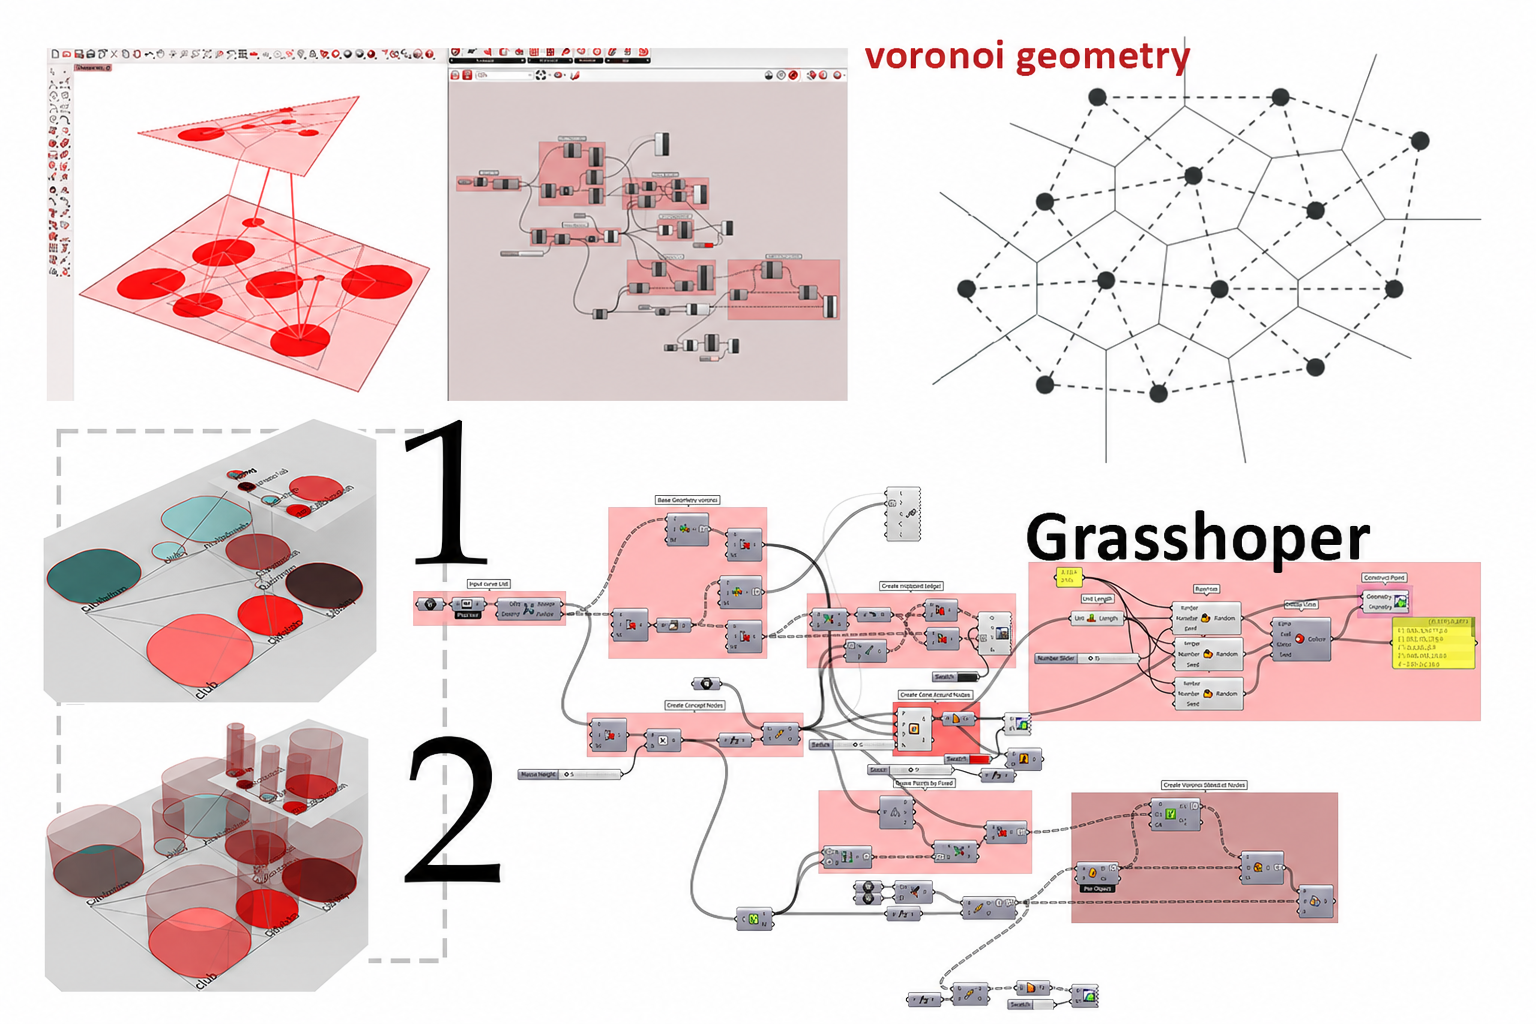
Bubble Diagram
A custom interactive diagram where each space is a circle sized by its required area, connected to other spaces by lines whose thickness shows relationship strength. The first time the data actually made visual sense.
The problem: everything was flat. No way to show vertical connections between floors, and limited control over placement to test alternative configurations.
Final tool
SpaceGraph
Built in Grasshopper inside Rhino, SpaceGraph kept everything that worked in the bubble diagram and added what was missing: drag-and-drop control, real-time updates, and a clear visualization of vertical floor connections as a separate layer.
For the first time, I could actually design with the diagram rather than just read it.
The interactive diagram
Try it yourself — drag any space to explore relationships.
This is a live version of the bubble diagram built from the actual building data. Each node is a space in the community center. Node size represents required area, line thickness represents relationship strength. Drag any node to reposition it and see how the relationships look with different spatial configurations.
SpaceGraph — Iranian Community Center, TorontoDrag nodes to explore
Floor 1
Floor 2
Weak relationship
Strong relationship
Built from real thesis data: 13 spaces, 2 floors, weighted relationships from the original concordance matrix.
The Grasshopper version
The same idea, taken into 3D.
The interactive diagram above shows the concept. In the actual thesis, I rebuilt this tool inside Grasshopper — Rhino's visual programming environment — which added the vertical dimension. Spaces could be distributed across floor levels, and connections between floors appeared as a distinct visual layer. You could drag any space in the 3D viewport and every connected line updated in real time.
The Grasshopper node network, the 3D visualization with floor levels, and the Voronoi geometry used to test adjacency patterns. Bottom row shows two different floor configurations.
⚪
Size-encoded nodes
Each space is sized by its required area, so larger rooms are immediately obvious in the diagram.
〰️
Weighted connections
Lines between spaces vary in thickness based on how strong the functional relationship needs to be.
🏢
Vertical floor relationships
Floor-to-floor connections appear as a distinct visual layer, making vertical circulation visible for the first time.
🔄
Live drag interaction
Spaces can be repositioned freely. Relationships update in real time as you explore alternatives.
The concordance matrix data table and six different configurations of the diagram as the relationship threshold filter changes.
Tech stack
Parametric design, custom built.
GrasshopperRhino 3DPythonJavaScriptD3.jsd3graph
Outcome
A diagram you can think with, not just read.
SpaceGraph made it possible to move between the data and the design in a way the concordance matrix never did. By the time I was done with it, the diagram had become a genuine part of the design process, not just a reference document but something I was actively working with to test ideas and understand the building spatially before committing to a layout.
Something that stayed with me
This project taught me that the tools you use shape what you can think. A table keeps you in analysis mode. A diagram you can drag and reshape puts you in design mode. That's a small distinction that makes a big difference, and it's something I think about a lot when designing interfaces now.